Today, investors have greater access to information than any previous time in history. With just a few short keystrokes on a computer keyboard, investors can tap into the global arena of advice, analysis, ideas, opinion and statistics.
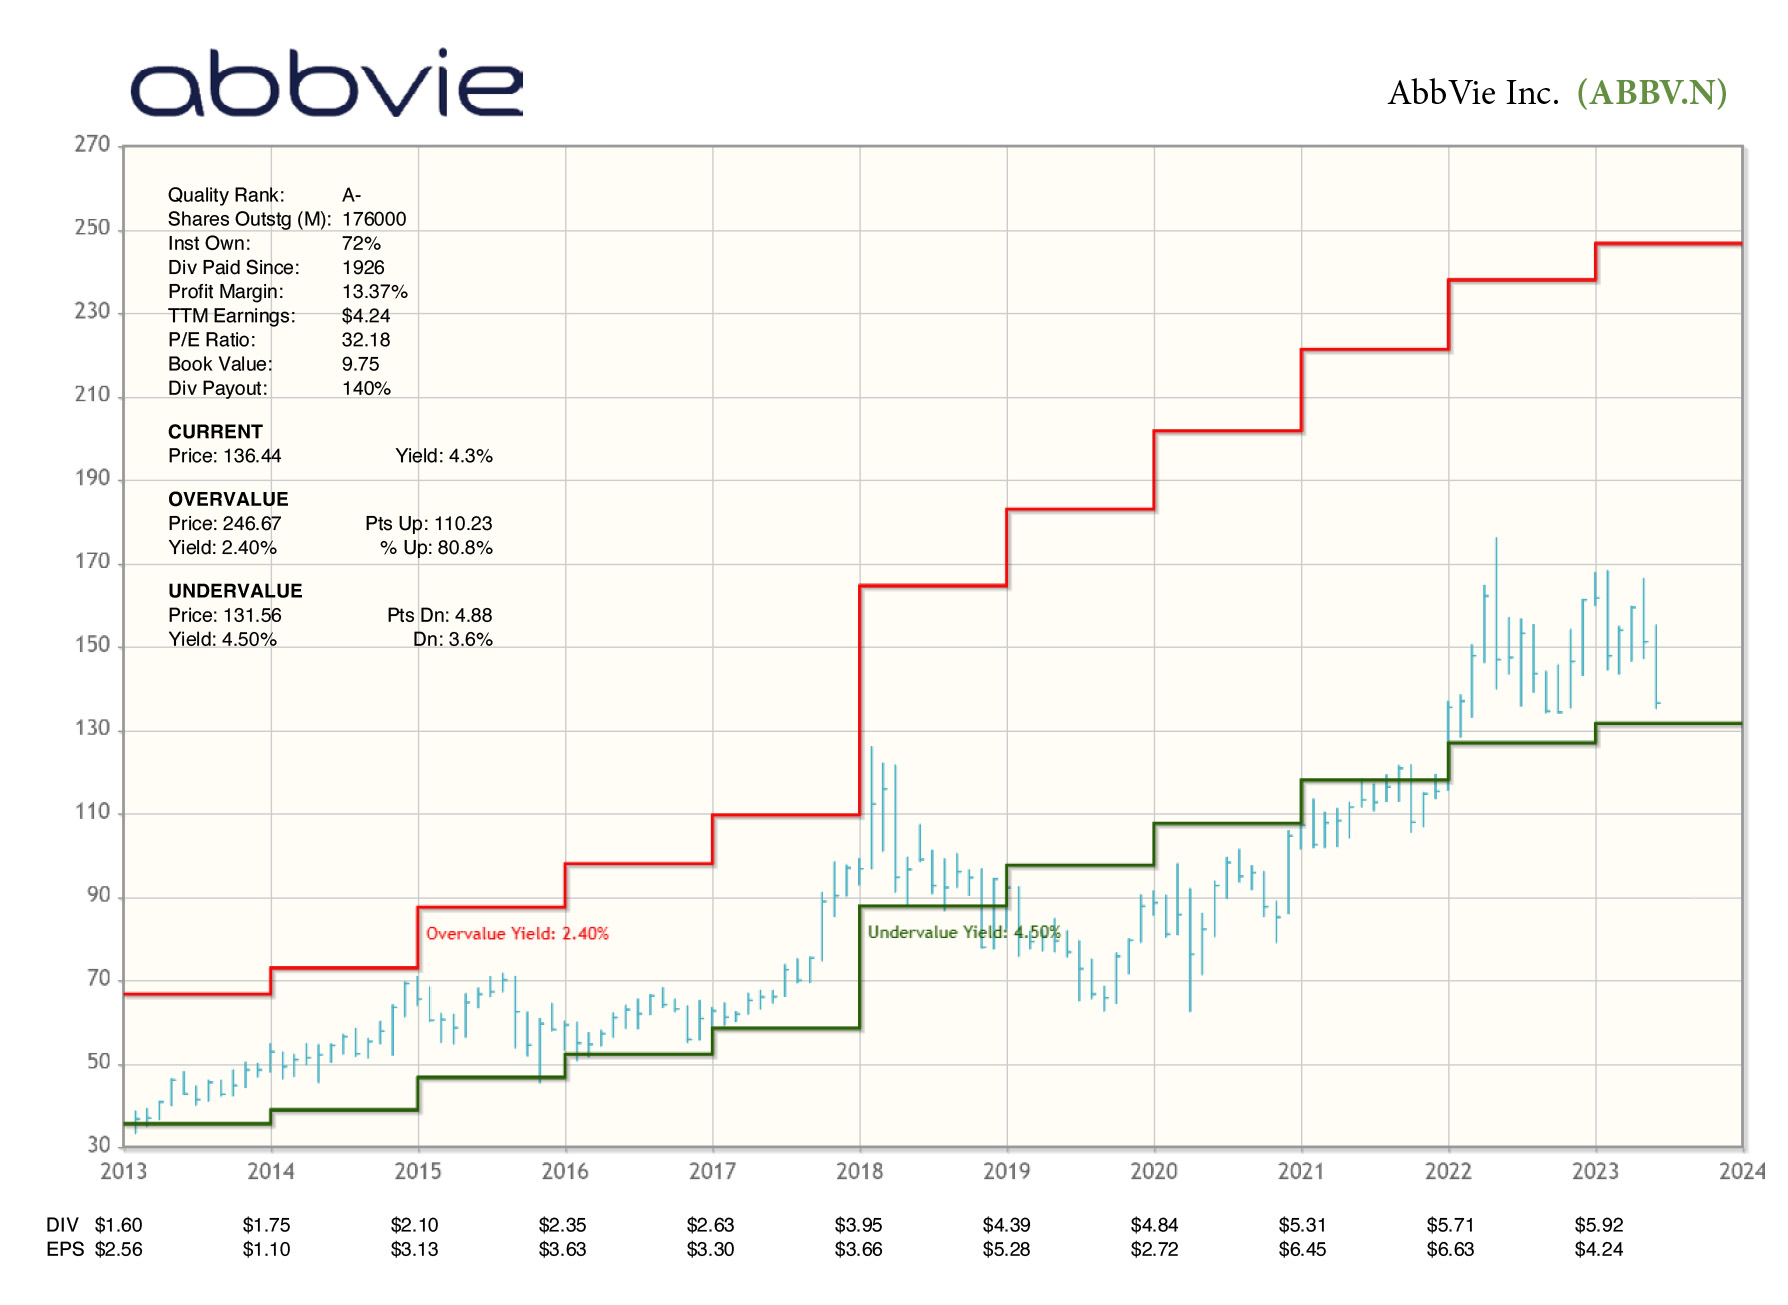
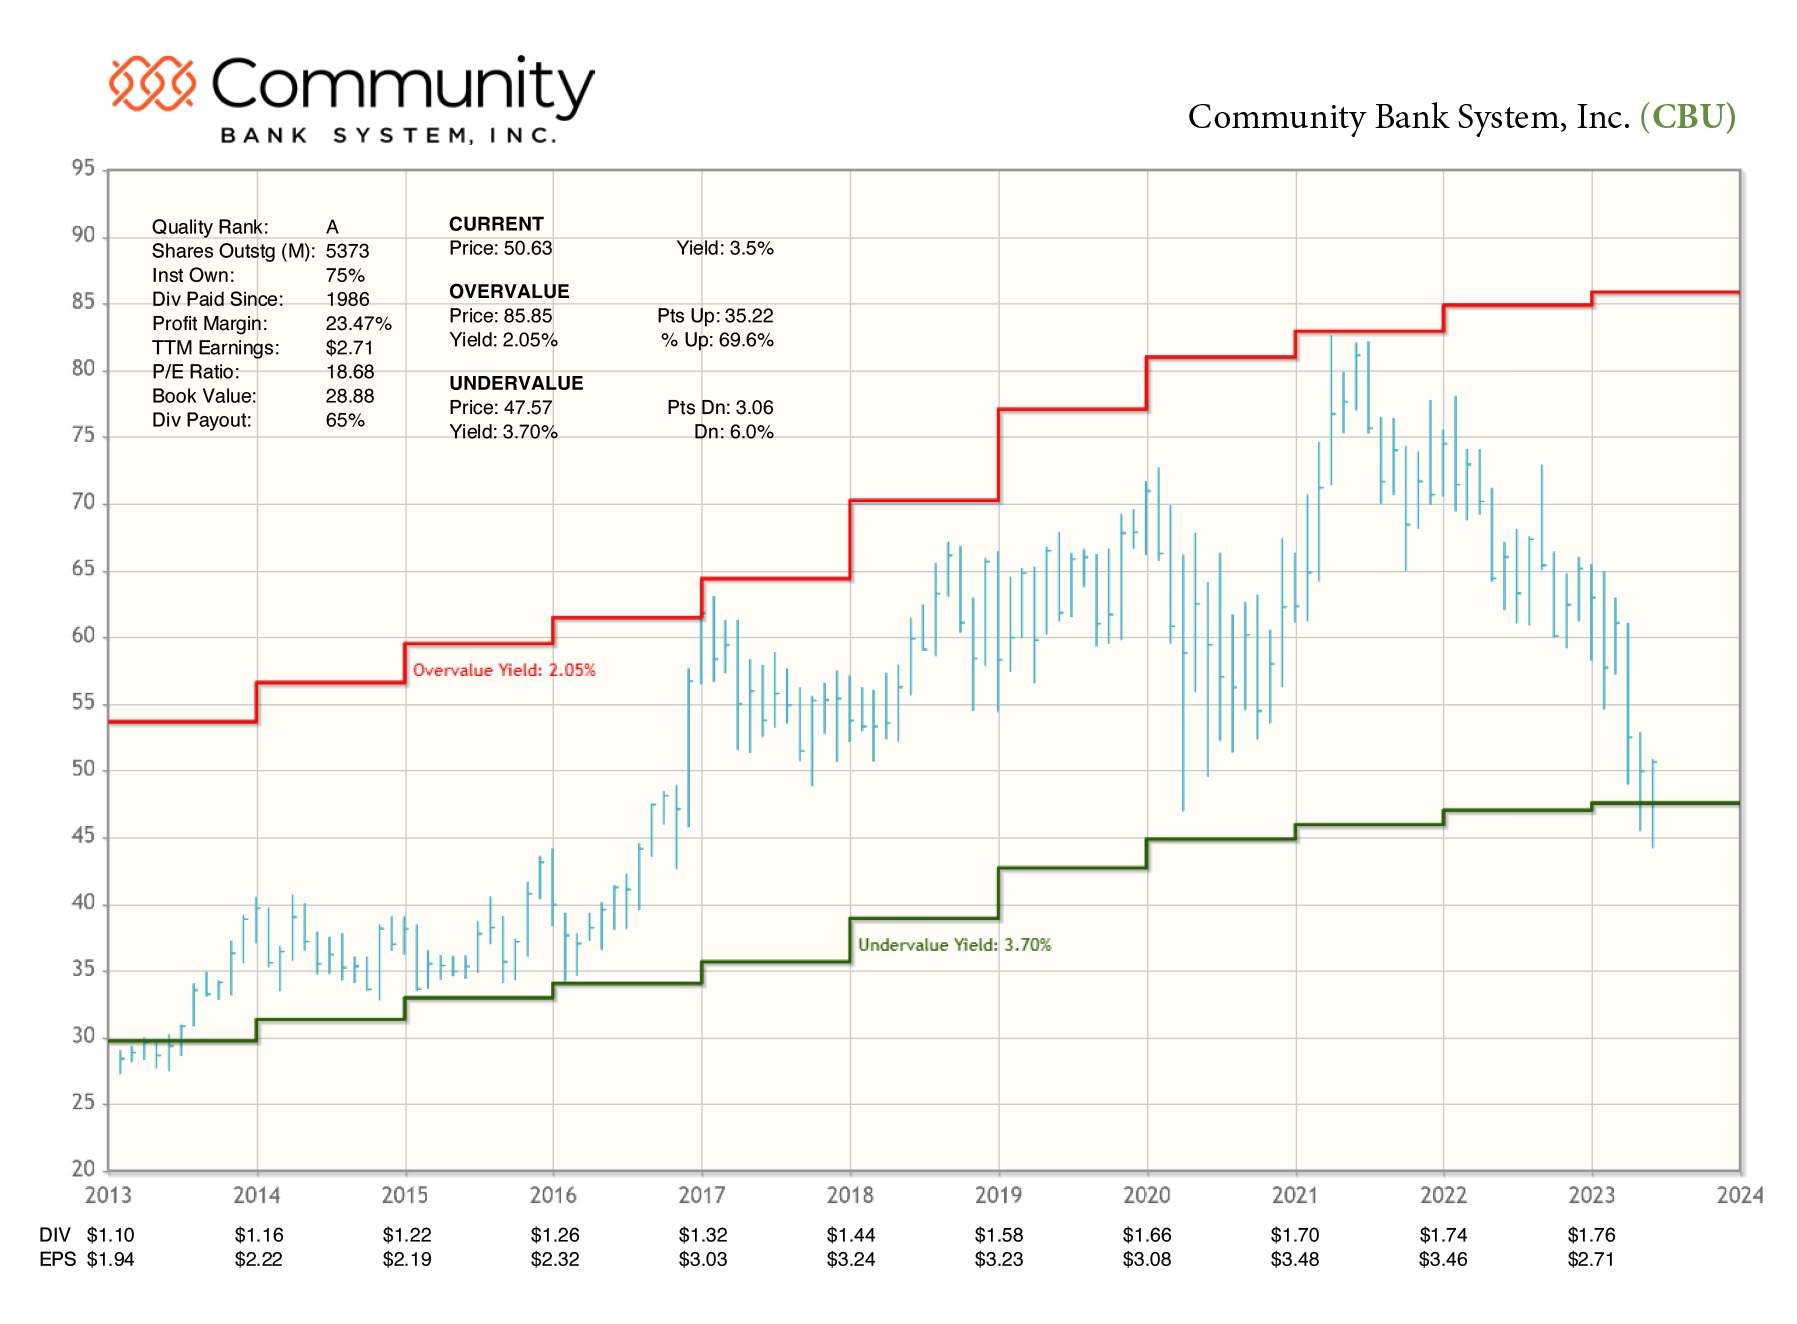
To help our readers better visualize our approach, IQ Trends produces proprietary charts that graphically display the data presented in our data tables. Unique to our charts are the areas of Undervalue and Overvalue dividend yield that overlay the price history in stair step fashion, as illustrated in the TJX Company Inc. (TJX) chart below. These charts cannot be obtained from any other source.
Information about a publicly traded company from any point on the globe is readily available from no fewer than a dozen financial portals and websites. In the majority of cases this information is redundant due to the fact that the origin of the data and information is the annual reports to regulators or from the corporate websites of the respective companies.
The downside of this information windfall is that much of it is reformulated, regurgitated and rehashed. Indeed, it is rare to find information that is unique, original and that contributes significantly to an investor’s primary goal -- realizing a return on investment.
The Investment Quality Trends approach rests squarely on the twin pillars of quality and value. Our Criteria for Select Blue Chips is our filter to identify quality and our Profiles of Dividend Yield is our metric to identify value.
We love to hear from our subscribers so reach out any time. Kelley will answer your emails and calls personally. Send to subscribers@iqtrends.com.