Blue Chip Criterion Explained

One of the most long-lived of all investment newsletters, Investment Quality Trends has been making money for its subscribers since 1966, following the wonderfully old-fashioned idea that one should purchase the top dividend-paying stocks when the dividend yield is historically high, sell when the dividend yield declines to historic lows and completely avoid stocks which pay no dividend at all.

Criterions 1 and 6: Dividend Increases and Earnings Improvement

Both Criterions 1 and 6 reference 12 years; dividend increases in five of the last 12 years and earnings improvement in seven of the last 12 years. One of the most frequent questions we are asked is what is so special about 12 years? The average business/economic cycle lasts approximately four years. Over the course of 12 years then, the economy and markets will go through three complete cycles. During that period, a company will experience the inevitable economic surprise, be it on a macro level, which affects all companies, or on a micro level , which is specific to that company, industry, or sector. There is an equally high probability for major legislative and/or tax changes that will require a period of adjustment. In short, adversity is part of the cost of doing business. As such, a consistent track record for earnings growth is not only difficult to achieve, but also to sustain over significant periods of time.

For a company to meet both of these criteria, their earnings and dividends must show consistent improvement. Steady and improving earnings and dividend performance over the course of 12 years is not luck; it is evidence of strong and capable management. The most reliable measure of good management is long-term performance, a proven ability to grow the net earnings of its company and maintain a rising trend of increased dividends. You work hard to save the capital you put to work in the markets. Don't entrust it to just any company; put it to work with the best.

Criterion 2: S&P Quality Ranking in the “A” Category

Standard & Poor's has provided Earnings and Dividend Rankings, simply referred to as Quality Rankings, on common stocks since 1956. According to Standard & Poor's:

“The Quality Rankings System attempts to capture the growth and stability of earnings and dividends record in a single symbol. In assessing Quality Rankings, Standard & Poor's recognizes that earnings and dividend performance is the end result of the interplay of various factors such as products and industry position, corporate resources and financial policy. Over the long run, the record of earnings and dividend performance has a considerable bearing on the relative quality of stocks. The rankings, however, do not profess to reflect all of the factors, tangible or intangible, that bear on stock quality. The rankings are generated by a computerized system and are based on per-share earnings and dividend records of the most recent 10 years--a period long enough to measure significant secular growth, capture indications of basic change in trend as they develop, encompass the full peak-to-peak range of the business cycle, and include a bull and a bear market. Basic scores are computed for earnings and dividends, and then adjusted as indicated by a set of predetermined modifiers for change in the rate of growth, stability within long-term trends, and cyclicality. Adjusted scores for earnings and dividends are then combined to yield a final ranking.”

The Standard & Poor's Earnings and Dividend Rankings for Common Stocks are as follows:

A+: Highest A: High
A-: Above Average
B+: Average
B: Below Average
C+: Lower
C: Lowest
D: In Reorganization
NR: A ranking of NR signifies no ranking or insufficient data because the stock in not amenable to the ranking process.

For inclusion in the universe of Select Blue Chip Stocks, a company must initially have at minimum an A- Quality Ranking. The company may remain in the roster if its Quality Ranking declines to a B+, but will be removed from the listing if it is downgraded further.

Criterion 3: At Least 5 Million Shares Outstanding

With enough common shares outstanding, a stock is assured of liquidity; we never want to be in the position of having to make an appointment to buy or sell a stock. Institutional investors, whose importance to our method is explained below, prefer to invest in companies that are liquid so they can establish large investment positions without disturbing the price of the stock. Equally important is that when the time comes to sell, they want to know that there will be sufficient numbers of buyers. Few experiences are as frustrating as trying to buy or sell a large position in a thinly traded stock. For institutional investors who frequently deal in large sums of capital, an orderly entrance and exit are extremely important. Lastly, liquidity helps to guard against share price manipulation.

Criterion 4: At Least 80 Institutional Investors

When we use the term Institutional Investor, we are referring to the vast number of mutual funds, exchange traded funds (ETF's), hedge funds, banks, insurance companies, pension fund and retirement companies, major brokerages and money managers. On any given trading day, these groups account for the vast majority of trading activity. As such, their collective buying and selling decisions exert an enormous impact on the trend of stock prices.

Whether they choose to acknowledge it or not, institutional investors exhibit some fairly predictable behavior. This is due, in no small part, to the fact that it is a closely linked community. This is to say that they associate with, listen to, and behave like other institutional investors. As value investors, we can use this propensity for like-minded behavior to our advantage.

It is not uncommon when using the dividend-value strategy to be early to the table, which means that we often take positions in high-quality companies that offer excellent historic value long before other investors. Eventually one or two institutional analysts will stumble upon one of our companies, write up a buy recommendation, and distribute it to its traders or sales force. Nothing in the institutional community remains secret very long, so when the word gets out, the full force that is institutional buying power kicks in. Strong institutional buying eventually hits the radar screens of our favorite investor type: the momentum investor In simple terms, a momentum investor attempts to capture capital gains by buying a stock with a discernible uptrend in price, or to short a stock with a discernible downtrend in price. The underlying belief is that, once a trend has been established, it is likely to continue in that direction than to move against the trend.

There is nothing intrinsically wrong with this idea. In fact, we engage in some momentum investing ourselves. There is nothing more attractive than a high-quality company with an undervalue price, a high-yield and upward momentum in its dividend trend. So this really isn't momentum investing, but we think you get the point. To bring this point to conclusion, between institutional interest and momentum investing, stocks that we purchased at excellent historic value will often reach their historic upside potential, at which point we lock in our profits and search for another high-quality undervalued opportunity.

Of the six criterions for Select Blue Chips, the number of institutional sponsors is the least rigid, which is to say there is nothing magical about the number 80. What is important is evidence of widespread interest in a stock, and that it has attracted a broad and diverse institutional following. In terms of of price stability, we prefer to find that 80 or more institutions hold 50 percent of the common shares outstanding, rather than one or several institutions holding the same amount; with diversity comes an element of safety. Most full-service brokers and investor databases can provide information on the number of institutional investors and their percentage of holdings in any individual stock.

Criterion 5: At Least 25 Years of Uninterrupted Dividends

Of the six criterions that comprise the Criteria for Select Blue Chips, this is the one that separates the big dogs from the pups. We are often asked if there is really a meaningful difference between a company that has paid uninterrupted dividends for 25 years and one with 10, 15, or 20. The short answer is absolutely. In a sufficient number of instances, our research indicates there is a greater likelihood for price volatility and less reliability in the trends of earnings and dividends for companies with shorter track records of uninterrupted dividend payments.

Although we lack a single empirical measurement that explains this phenomenon, our best guess based on our experience is that the market, which posseses all the wisdom from its collective participants, has determined that companies that have achieved this milestone have earned elite status and investors simply treat them differently. What we do know is that over a 25- year period a company will go through many business and economic cycles, will experience the exhilaration of bull markets and the despondence of bear markets, will see their products or services enjoy periods of wide popularity and periods of less; the list can go on and on.

In the final analysis we believe it all boils down to one factor: competence. If a company can weather the myriad challenges it will inevitably face over such a period of time and maintain a strong record of earnings growth and maintain a rising dividend trend that is competence. If a company can keep its products and services at the forefront of consumer interest, or reinvent itself if necessary, that is competence. If a company can consistently attract, train, and retain the next generation of management that will continue a tradition of excellence, that is competence.

You work hard to save the investment capital you put to work in the financial markets. All things being equal, who are you most comfortable associating that capital with? For us the answer is easy; the most competent companies we can find.

Of the six criterions that comprise the Criteria for Select Blue Chips, this is the one that separates the big dogs from the pups. We are often asked if there is really a meaningful difference between a company that has paid uninterrupted dividends for 25 years and one with 10, 15, or 20. The short answer is absolutely. In a sufficient number of instances, our research indicates there is a greater likelihood for price volatility and less reliability in the trends of earnings and dividends for companies with shorter track records of uninterrupted dividend payments.

Although we lack a single empirical measurement that explains this phenomenon, our best guess based on our experience is that the market, which posseses all the wisdom from its collective participants, has determined that companies that have achieved this milestone have earned elite status and investors simply treat them differently. What we do know is that over a 25- year period a company will go through many business and economic cycles, will experience the exhilaration of bull markets and the despondence of bear markets, will see their products or services enjoy periods of wide popularity and periods of less; the list can go on and on.

In the final analysis we believe it all boils down to one factor: competence. If a company can weather the myriad challenges it will inevitably face over such a period of time and maintain a strong record of earnings growth and maintain a rising dividend trend that is competence. If a company can keep its products and services at the forefront of consumer interest, or reinvent itself if necessary, that is competence. If a company can consistently attract, train, and retain the next generation of management that will continue a tradition of excellence, that is competence. You work hard to save the investment capital you put to work in the financial markets. All things being equal, who are you most comfortable associating that capital with? For us the answer is easy; the most competent companies we can find.

BLUE CHIP INFO NOTES

The Blue Chip Info Notes is the area readers find information about changes that have taken place within our universe of Select Blue Chips in between issues. We use typographic identifiers such as BOLD or ITALIC or BOLDED ITALICS to alert readers to new arrivals in a category and increases/decreases to earnings and dividends.

In addition readers will find whether there are new additions to the newsletter, downgrades to the Faded Blue Chips or if stocks have been eliminated entirely from our universe of Select Blue Chip stocks. Lastly this is the area where we highlight a change in the dividend yield profile of value for one of our stocks.

SELECT BLUE CHIPS - SUMMARY

Since the dawn of stock-market analysis, investors have searched for the one indicator that is perfect in its predictive capabilities. Although it is titillating to entertain such a notion, if such an indicator were to exist, it would eventually destroy the markets because all risk would be removed for the practitioners and they would eventually own everything.

Even when investors are successful at identifying the primary trend of the market, there are stocks that rise during bear markets as well as stocks that decline during bull markets. All things being equal, we would rather know the direction of the primary trend as not, however, market indicators can only tell you what the current temperature of the market is, not where to find good current value. The truth of the matter is there is the stock market and there is the market of stocks, which are two entirely different things.

We have reached that understanding after having observed our market of stocks, the Select Blue Chips, over the course of the last 46-plus years. As a result of these observations, we have developed another cyclical indicator, which measures what is always most important - Values.

Our universe of Select Blue Chips is grouped into four distinct categories: Undervalued; Rising Trends; Overvalued; and, Declining Trends. The Undervalued category consists of stocks that represent historically repetitive extremes of low-price and high dividend-yield. The Rising Trend category consists of stocks where the stock price has risen at least 10 percent from its undervalued base. The Overvalued category consists of stocks that have reached historically repetitive extremes of high-price and low dividend-yield. The Declining Trend category consists of stocks where the stock price has declined at least 10 percent from its overvalued peak. Twice each month, we calculate how many stocks are in each category and what percent that number is of the total. For over 46 years we have tracked each category in the Investment Quality Trends Blue-Chip Trend Verifier, as displayed in the table and pie chart above.

By tracking the movements between categories and comparing those movements against the highs and lows on the DJIA, we have established that whenever the percentage of stocks in the Undervalued category rises between 70 percent and 80 percent of the total, it has been coincident with a low cycle in the DJIA and many good buying opportunities. In contrast, when the percentage of stocks in the Undervalued category declines to 17 percent or less, it has been coincident with a high cycle in the DJIA, where the market is overvalued and susceptible to a major market decline.

The Lucky 13

The Lucky 13 stocks that outperform the market

The Lucky 13 appears in the January issue of the newsletter and shows 13 stocks we think can outperform the market.

In short, The Lucky 13 has been extremely successful and not surprisingly, quite popular. While not every stock in each Lucky 13 portfolio has been a winner, there have been sufficient winners in each group to produce 15 years of positive total returns, twelve of which have exceeded 10%.

The Timely Ten

The Timely Ten undervalued stocks

Whether you are looking to build a portfolio from scratch, are partially invested and looking to add new positions, or are fully invested and merely in need of some affirmation and hand holding, The Timely Ten presents our top ten recommendations as of each issue.

Short of utilizing the personal investment management services of our sister company, IQ Trends Private Client Asset Management, this is as close to real time as you can get.

Investment Outlook

investment outlook articles by Kelley Wright

The Investment Outlook can be found in each issue, and is where our Editor presents his thoughts on the general state of the markets, a specific stock or industry, or a discussion about value identification and our methodology.

Since assuming the helm as Managing Editor in 2002, Kelley Wright has penned the majority of commentaries, which have ranged far and wide afield. Whether didactic, philosophical or with a touch of whimsy, Kelley most definitely has never been one at a loss for words.

About the Charts

about the charts

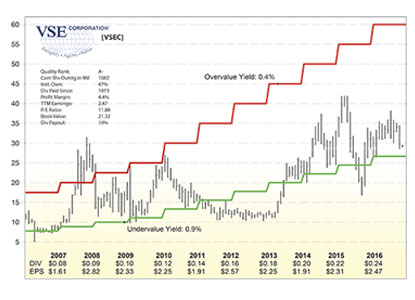
In each issue, with the exception of the first of the quarter, IQ Trends publishes four of our proprietary charts. These charts range from new entries into the Service, new entries into the Undervalued category or modified Profiles of Dividend Yield, companies in the Timely Ten, or companies that exhibit characteristics that show promise.

As a value added benefit to our subscribers, IQ Trends now allows access our archive of proprietary charts. No longer will subscribers have to wait for their favorite company to fall into one of the above mentioned categories for its chart to be published.

Newsletter Performance

Contact

We love to hear from our subscribers so reach out any time. Kelley will answer your emails and calls personally. Send to subscribers@iqtrends.com.


Download Agreement Forms