Investment Quality Trends provides a significant amount of fundamental and technical information and data on high-quality, dividend-paying Blue Chip stocks. The degree to which this information and data is utilized by Subscribers depends on their experience, sophistication, and level of portfolio building expertise.
Because we follow such a wide variety of companies that are dynamically moving in price, along with a steady influx of new Subscribers, we do not construct and maintain model portfolios as it is impractical, if not impossible, to construct and maintain model portfolios to meet every Subscribers individual investment objectives.
In January, 2000, we initiated The Lucky 13 portfolio to assist subscribers in establishing a foundation for their investment portfolios. In the Mid-August 2006 issue of Investment Quality Trends, we initiated The Timely Ten feature to compliment The Lucky 13.
Accordingly, whether you are looking to build a portfolio from scratch, are partially invested and looking to add new positions, or are fully invested and merely in need of some affirmation and hand holding, The Timely Ten represents our top ten recommendations from the Undervalued category as of each issue. Short of utilizing the personal investment management services of our sister company, IQ Trends Private Client Asset Management, this is as close to real time advice you can get.
According to Mark Hulbert and the Hulbert Financial Digest, the performance returns for The Timely Ten are as follows
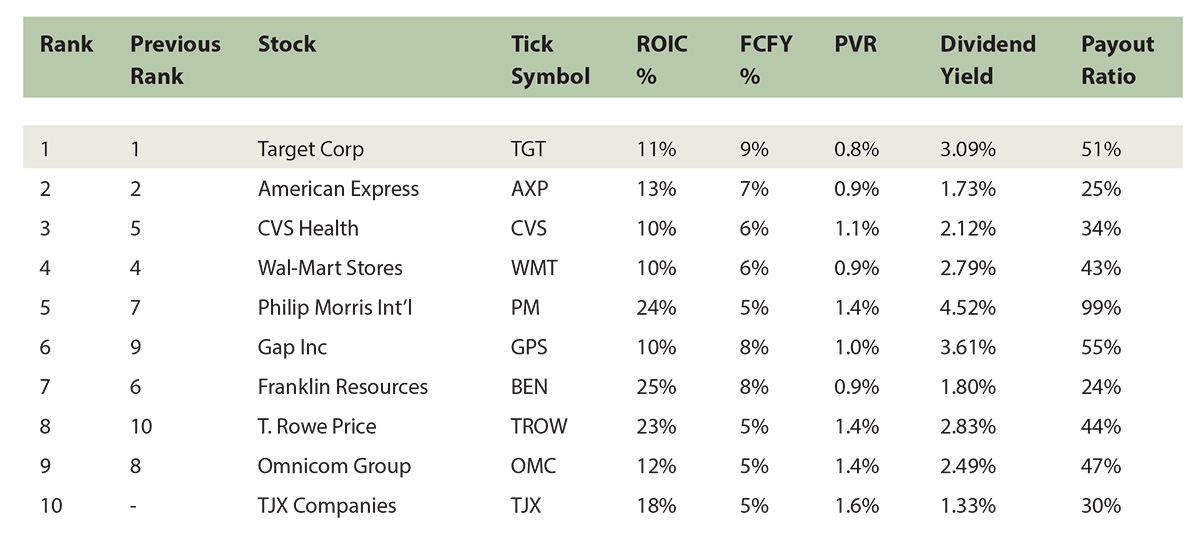
The Timely Ten can be found in each issue except for the First-January, where we present the Lucky 13. The format is easy to follow as can be seen in the sample below.
Historically, Subscribers that have relied solely on these criterions in their stock selection process have been handsomely rewarded over time. The only critique is that some stocks remain in the Undervalued area for a significant amount of time before they begin to demonstrate price appreciation. For the investor with a long-term investment time-horizon this is not an issue, as they are getting paid to wait from consistent dividend payments and dividend increases.
For the investor with a shorter-term investment time-horizon, the discipline and patience required to let the full value of a company be expressed in its stock price may prove too difficult, and result in them abandoning this time-proven strategy, which is unfortunate.
There are multifaceted explanations/reasons for why a stock may remain in the Undervalued area for an extended period. In our experience, although a company may offer excellent current value in terms of its dividend yield, its internal economic measures may not be sufficiently attractive for current buying interest, thus the high dividend yield and the extended period in the Undervalued category.
To augment the traditional criterions above, and to identify those Undervalued stocks that also have excellent internal economic measures, in March, 2016, we introduced metrics to The Timely Ten we use at Private Client to construct portfolios for managed accounts.
These metrics are: Return on Invested Capital (ROIC), Free Cash Flow Yield (FCFY) and Price to Value Ratio (PVR).
These metrics are: Return on Invested Capital (ROIC), Free Cash Flow Yield (FCFY) and Price to Value Ratio (PVR).
Return on invested capital (ROIC) measures how much profit a company generates for every dollar invested in the company. Our belief is it is the truest measure of a company’s cash on cash returns. As such, we are interested in companies that produce a lot of cash from their investments in the company because this is where profits, and therefore dividends, come from. We like an ROIC of at least 10%.
Free cash flow (FCF) is the amount of cash that remains after everything has been paid, all new investments have been made, and is available for distributing to all the equity shareholders. In the old days, we used to call this “profits.”
Our belief is the FCFY, which is the FCF divided by the adjusted enterprise value of the company, gives much greater insight to a company’s value than does the P/E ratio. We look for an FCFY of at least 5%.
Free cash flow yield (FCFY) is a ratio that compares the free cash flow to the value of the business. Most investors are familiar with the P/E Ratio, which is the price of the stock divided by the earnings of the company. With the way that earnings are calculated and reported, however, P/E’s are a questionable measure of value.
Our belief is the FCFY, which is the FCF divided by the adjusted enterprise value of the company, gives much greater insight to a company’s value than does the P/E ratio. We look for an FCFY of at least 5%.
Price to Value Ratio (PVR) is a measure of how the market is valuing the future growth prospects of a company. In our experience the Street tends to extrapolate the present into the future, forever, which is just plain silly.
Understanding this tendency gives us the opportunity find value where the Street does not, however. To keep this short and simple, a PVR of 1.0 indicates the Street is valuing the future growth to remain on par with the company’s historical average. Each tenth (.1) is a ten percent change in that assessment. For example, a PVR of 0.9 indicates the Street is valuing the future growth prospects of the company at a 10% discount from the company’s historical average – forever. A PVR of 1.1 indicates the Street is valuing the future growth prospects of the company at a 10% increase from the historical average – forever. We look for a PVR between 0 and 1.6, with the lower the number the better.
We love to hear from our subscribers so reach out any time. Kelley will answer your emails and calls personally. Send to subscribers@iqtrends.com.